TidyMass Shiny (Online service)

An object-oriented, reproducible analysis framework for LC-MS data


Streamlined LC-MS Data Analysis

TidyMass provides a comprehensive, reproducible workflow for metabolomics and lipidomics data processing, from raw data to biological insights.


Key Features

Object-Oriented Framework

Structured data representation ensuring reproducibility and traceability throughout the analysis workflow.

Comprehensive Workflow

From raw data processing to statistical analysis and biological interpretation in one integrated environment.

Reproducible Research

Complete analysis provenance tracking with version control for all processing steps and parameters.


Concept & Workflow

TidyMass Conceptual Framework
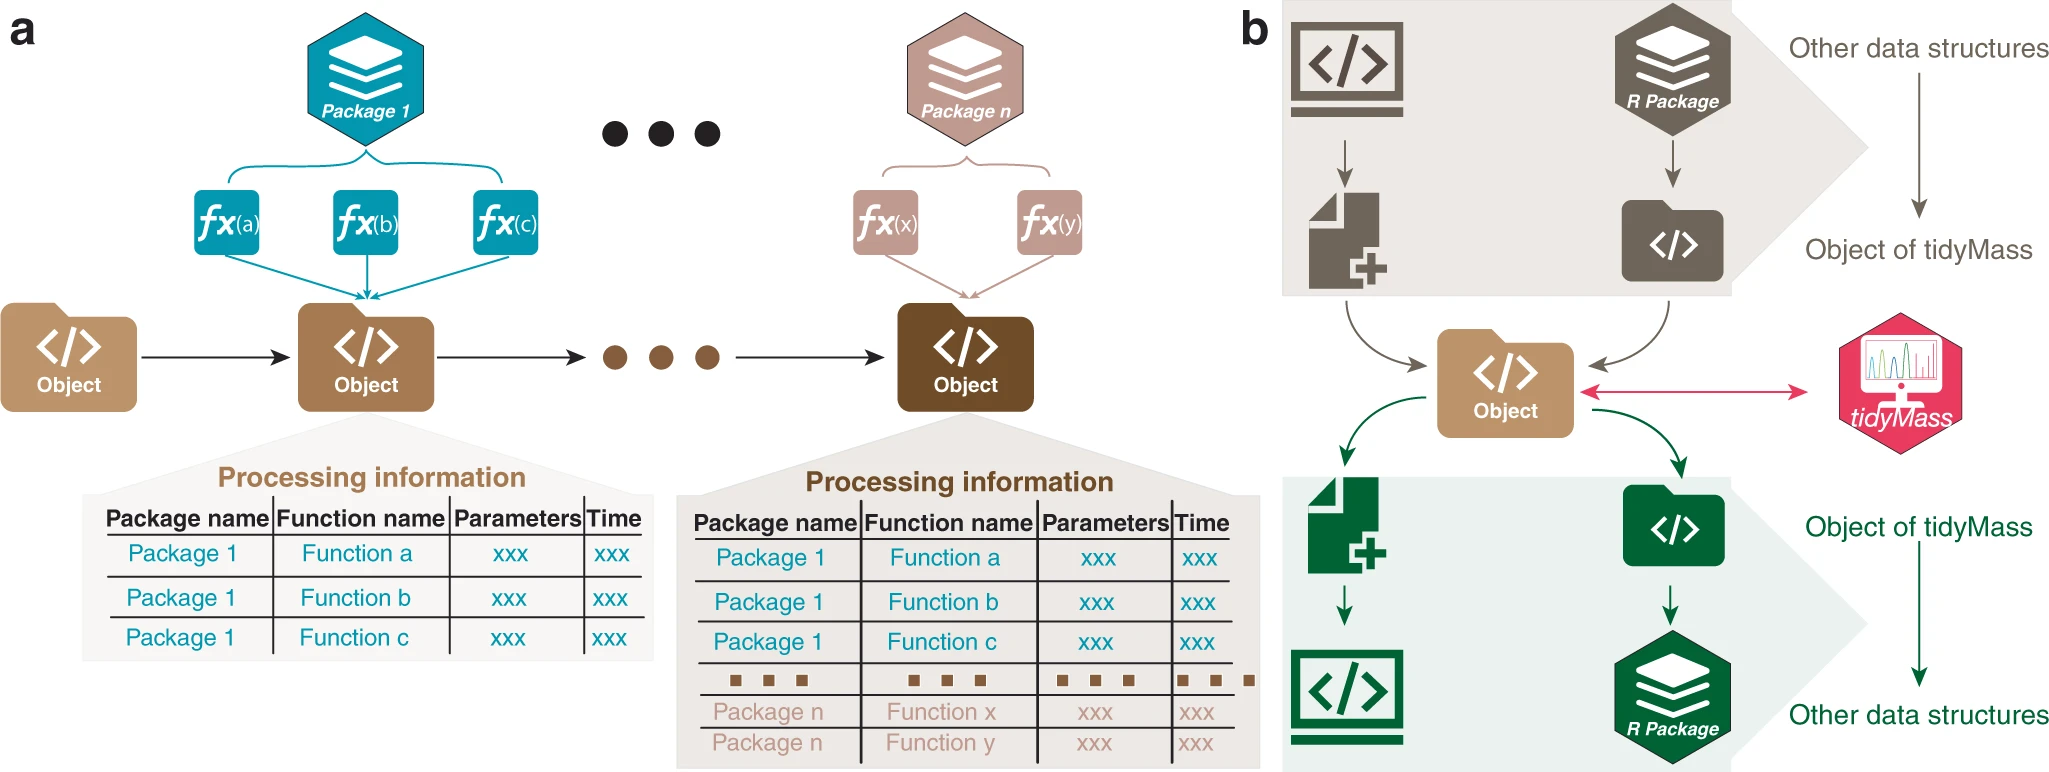
Comprehensive metabolomics data processing framework

Analysis Workflow
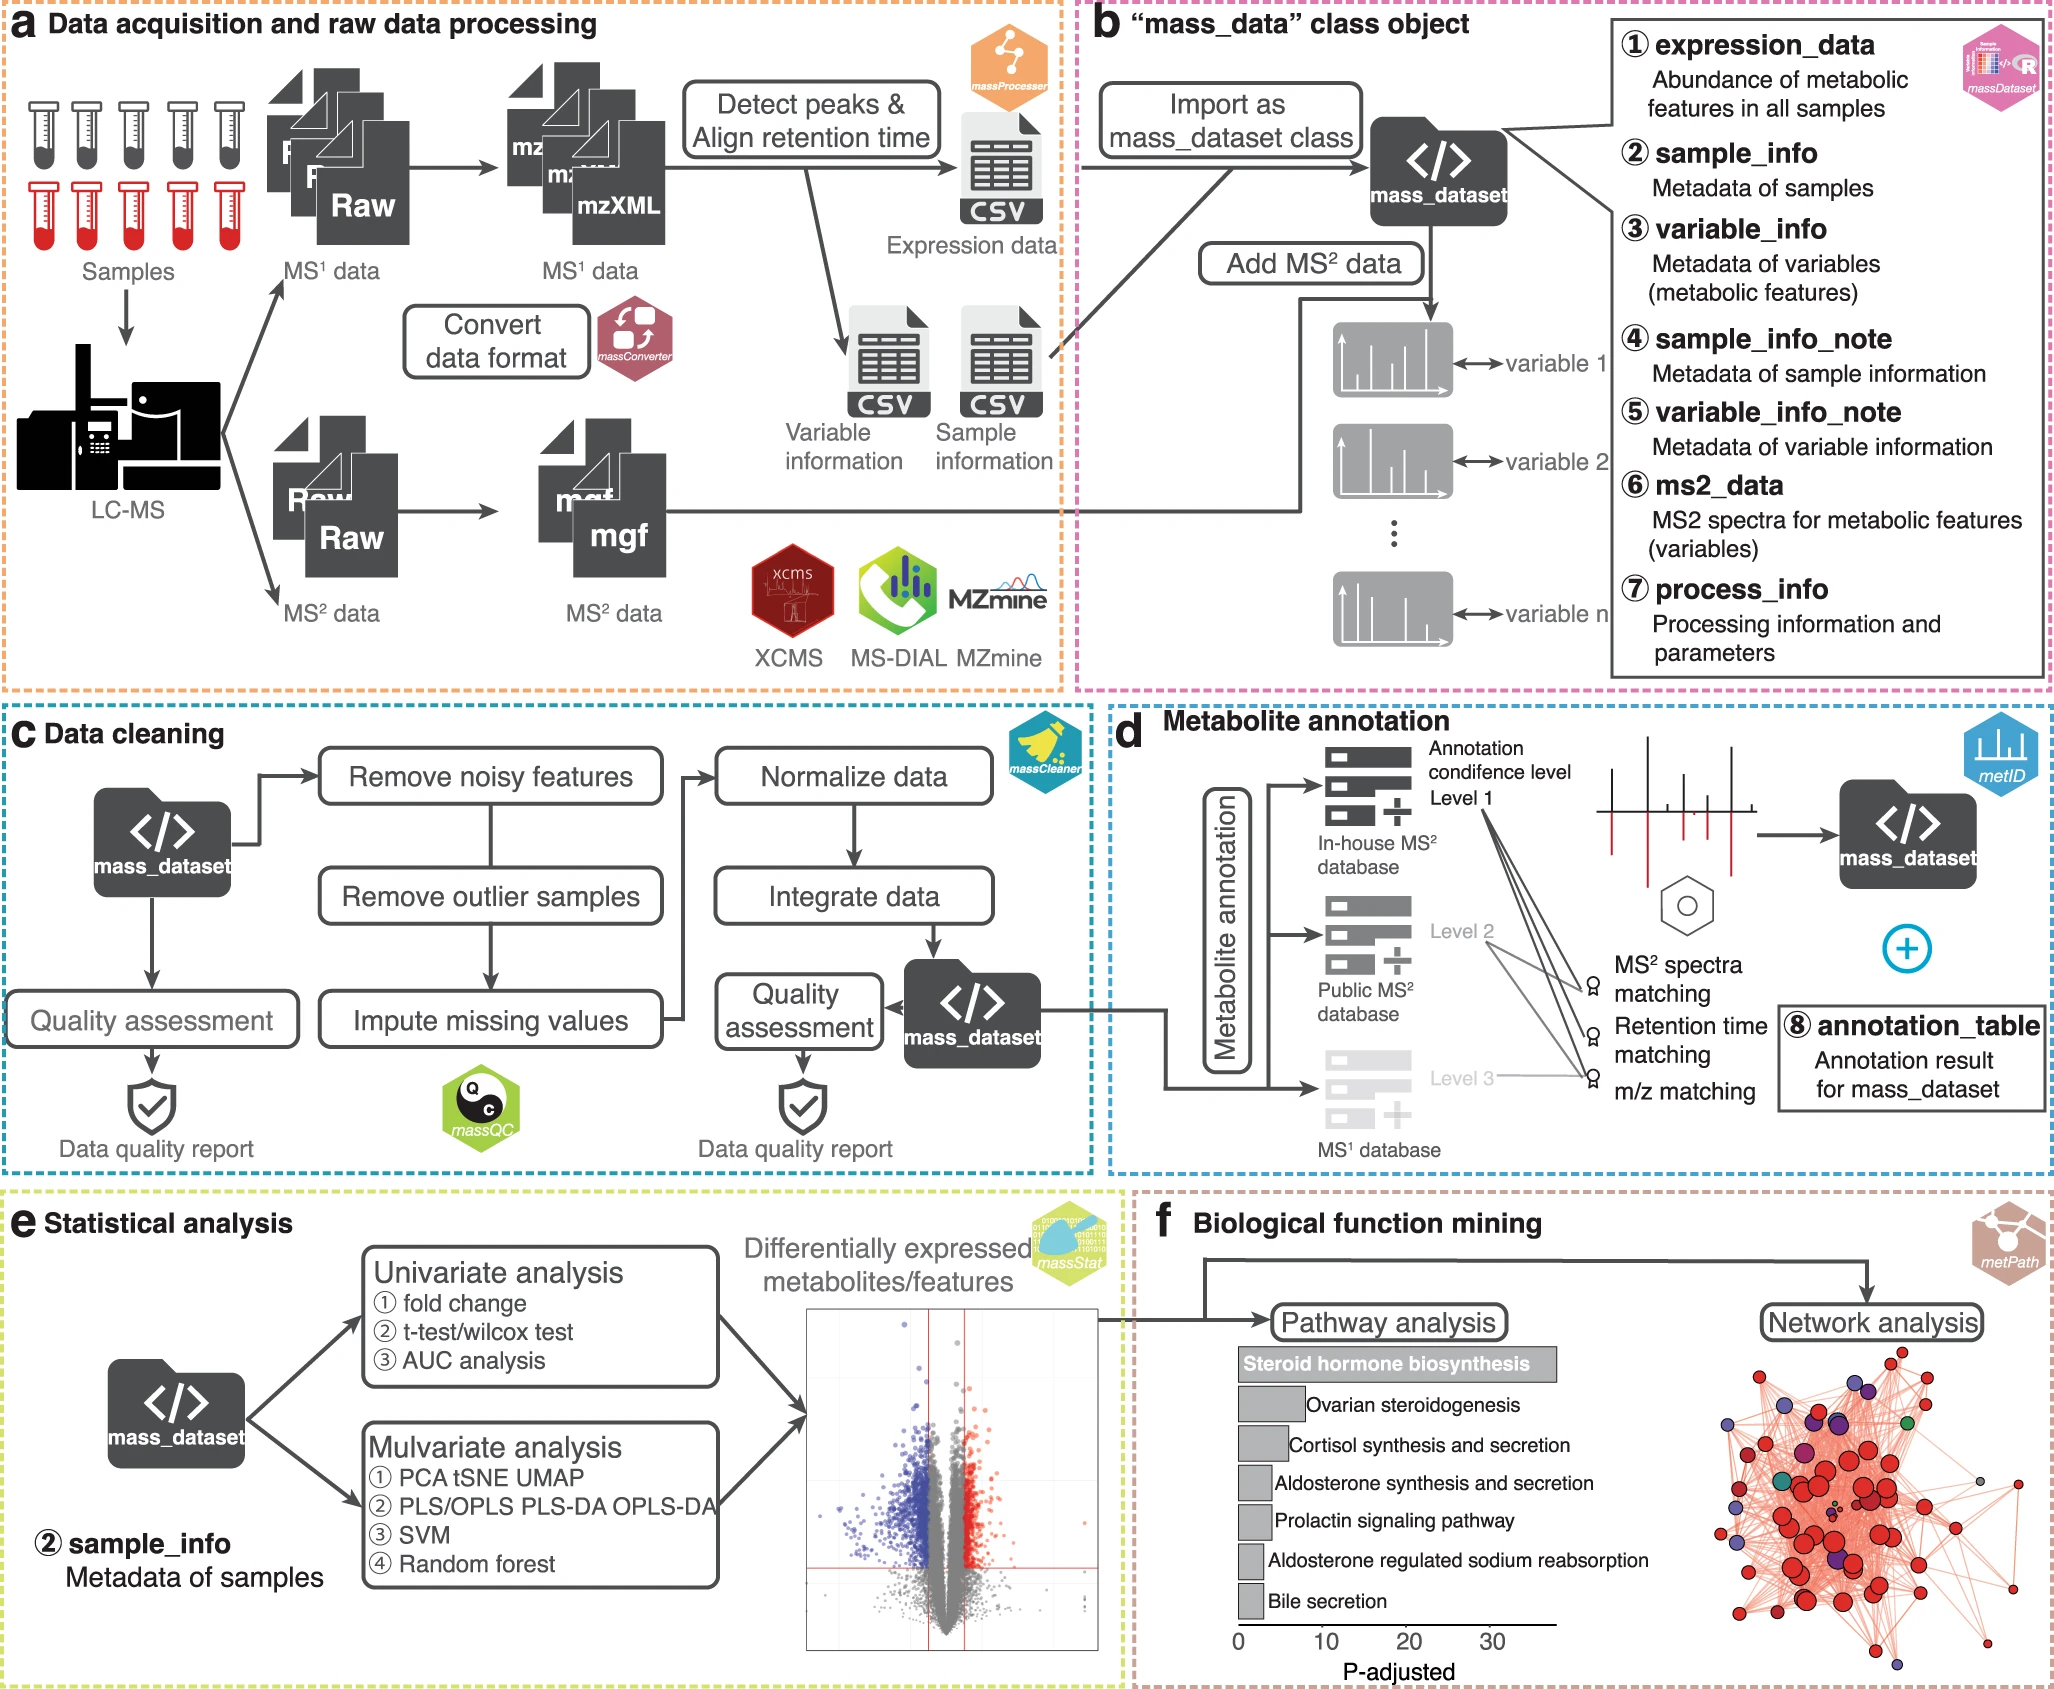
End-to-end LC-MS data processing workflow


TidyMass2 New Features
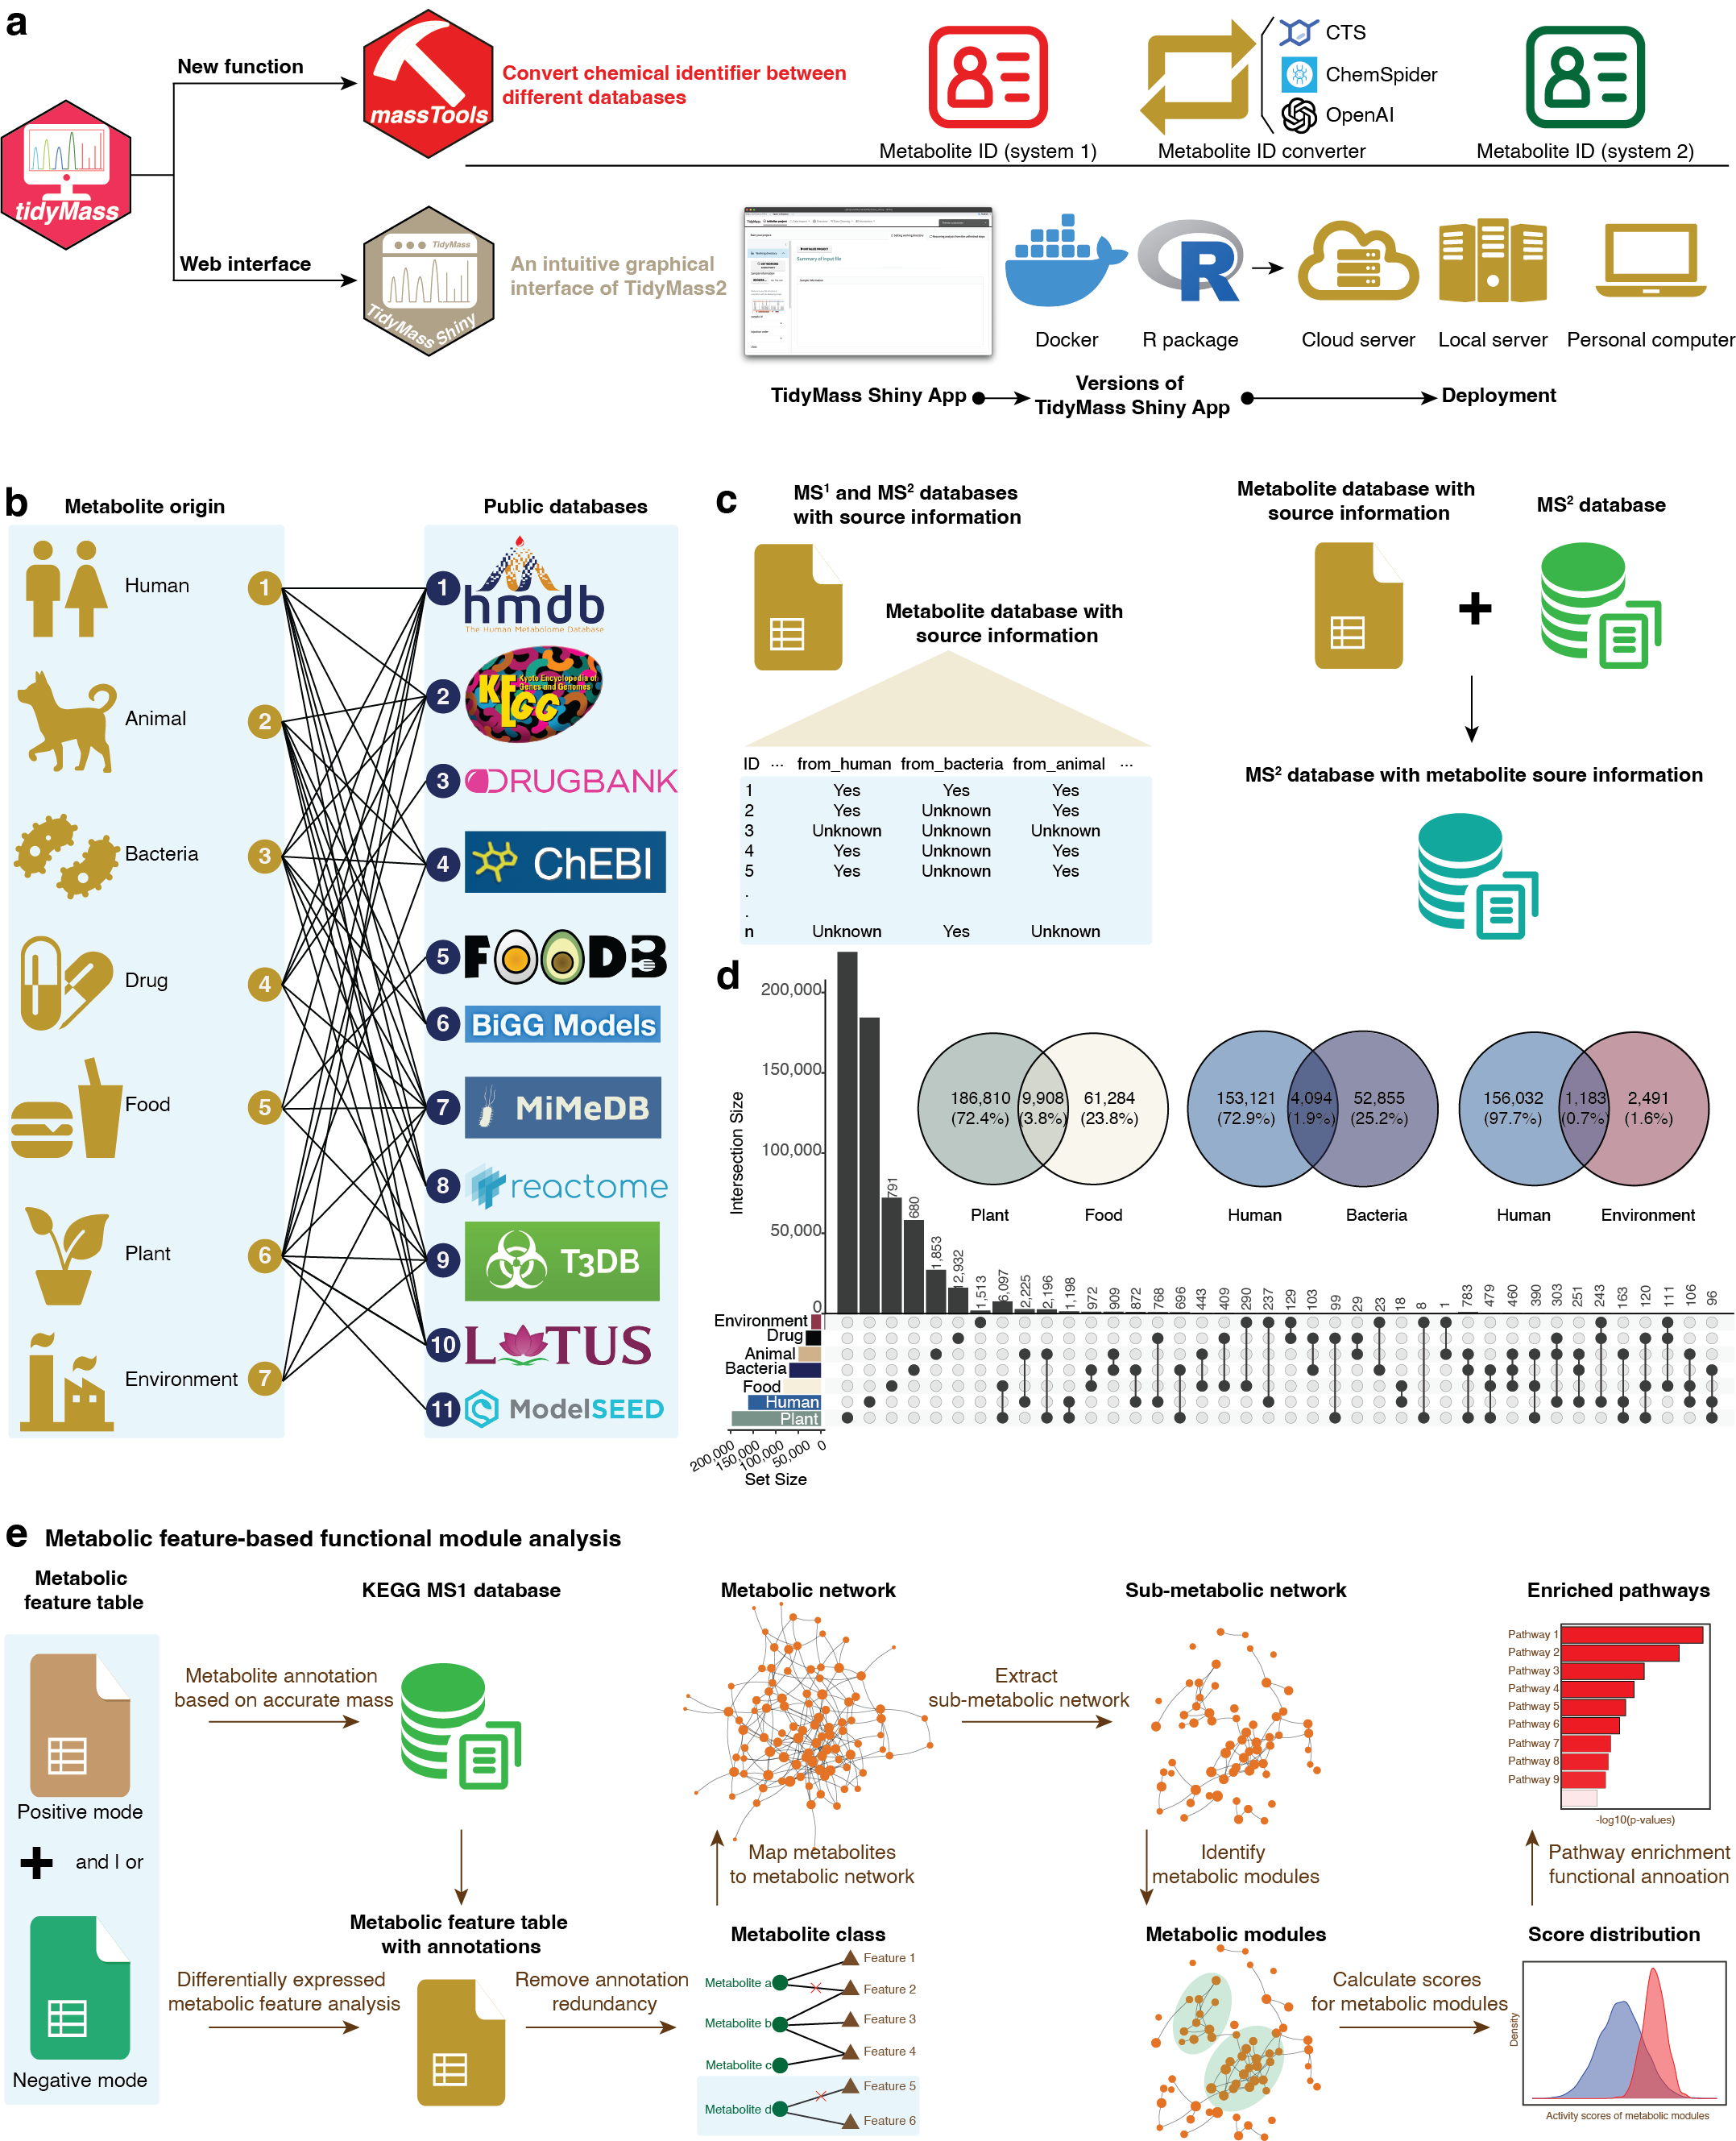
Advanced features in TidyMass2: Metabolite origin inference and metabolic feature-based functional module analysis

Key Innovations in TidyMass2:

  • Cross-Platform Identifier Conversion: Comprehensive chemical identifier conversion system operating across multiple metabolite ID systems.
  • Web-Based Analysis Interface: TidyMassShiny package providing a user-friendly web interface for all TidyMass2 functions.
  • Metabolite Origin Inference: Integration of 11 databases into MetOriginDB for precise metabolite source categorization across 7 origin categories.
  • Origin-Annotation Integration: Seamless connection between metabolite source information and MS2 spectral libraries for enhanced biological interpretation.
  • Feature-Based Functional Module Analysis: Novel network approach identifying biologically relevant metabolic modules without relying solely on MS2 annotation.
  • Comprehensive Metabolic Network: Human metabolic network with 9,630 metabolites and 30,196 connections for functional module detection.


Citation

If you use TidyMass in your publications, please cite:

Shen, X., Yan, H., Wang, C. et al. TidyMass an object-oriented reproducible analysis framework for LC–MS data. Nat Commun 13, 4365 (2022).

Wang, X., Liu, Y., Jiang, C. et al. TidyMass2: Advancing LC-MS Untargeted Metabolomics Through Metabolite Origin Inference and Metabolic Feature-based Functional Module Analysis.


Resources

Generated working directory:


Summary of input file


Sample information

Resuming task information


Positive model

                          
Negative model


Optimize peak picking parameters (option)


optimize peak picking parameters
Step1. find best ppm_cutoff
Step2. find best parameters for peak picking steps.

Start peak picking


Positive model

                            
Negative model

                            
Optimized parameters

Summary of input file

MS data summary
variable information
expression table

Output file path

Positive model

                        
Negative model

                        
Positive

                        
negative

                        
Peak distribution
Peak distribution plot in positive model
Peak distribution plot in negative model
Check missing value
Missing value summary in positive model
Missing value summary in negative model

Interactivecomplexheatmap DO NOT work when shiny version > 1.7.5 issue

Missing value in samples
MV percentage (sample) in positive model
MV percentage (sample) in negative model
Missing value in variables
MV percentage (variable) in positive model
RSD distribution
Cumulative RSD in QC in positive model
Cumulative RSD in QC in negative model
Intensity for all the variables
boxplot in positive model
boxplot in negative model
PCA plot in positive model
PCA plot in negative model
Sample correlation
Sample correlation in positive model
Sample correlation in negative model
MV percentage summary

description of noise remove method.

MV percentage plot


Missing value in samples
MV percentage (sample) in positive model
MV percentage (sample) in negative model
PCA plot in positive model
PCA plot in negative model
Summary of outlier detection


Expression data preview


Expression data

description of noise remove method.

PCA plot before normalization
PCA plot after normalization
RSD distribution before normalization
Cumulative RSD in QC in positive model
Cumulative RSD in QC in negative model
RSD distribution aftre normalization
Cumulative RSD in QC in positive model
Cumulative RSD in QC in negative model


Annotation table

description of noise remove method.


Annotation table


upsetplot
Network plot
PCA
PCA plot in positive model
volcano
Volcano Plot
DAM analysis result
Enrichment table
Barplot
Barplot
Enrich scatter plot
Scatter Plot
Dysregulated metabolic network
Module network
Download Database